Hydraulic strategies
|
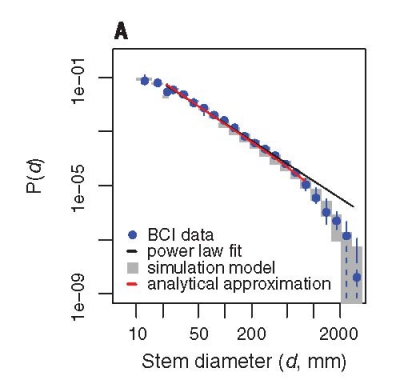
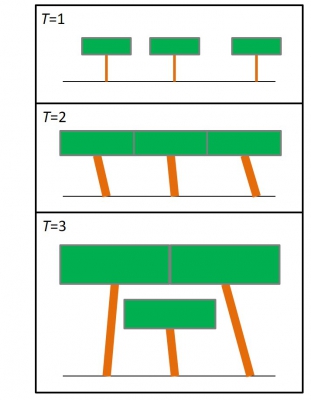
Although tropical forests are remarkably diverse and have large differences in growth and mortality rates of trees, their size distributions, the number of individuals by size class, seem constrained to the same, tight, power law distribution. Combining observational data with individual-based simulations and a mathematical model, we arrived at a new, biologically realistic, and parsimonious explanation for the consistency of the size distributions among tropical forests (Farrior et. al 2016, figure to the right). This model that predicts the size distribution of the Baro Colorado Island forest dynamics plot so well, is simple. Trees grow when they are tall enough that their crowns can fit in the sun, and grow slowly when they are overtopped. After a new gap is opened in the forest, many trees grow quickly now having full sun. But when their crowns begin to touch they start to leave individuals behind in the understory, a process that generates a size distribution of "losing" or "suppressed" individuals that can be described by a derivative of crown area allometry, a power law. A clip of the simulation model for a gap is shown below. The fact that it is the crown area allometry that effectively determines the power-law structure of the forest provides a simple explanation for the consistency of the size distribution across forests (Enquist et al. 2001) that do differ in growth and mortality rates (Muller-Landau et al. 2006). We are continueing to work on understanding forest structure and dynamics in many ways in the lab. In particular, Claire Fortunel is interested in understanding the role of species that may never attempt to reach the canopy and thus are not included in the model depicted to the right. We are also very interested in using these insights to further understand the similarities and differences between tropical and temperate forests. |
|
|
|
|
|
Simulation Model from Farrior et al. 2016 Science. A single patch simulation. The size distribution is plotted as the simulation runs through time. Each dot shows the number of trees in a size bin. *'s mark bins with zero individuals and the blue line is a smoothing across the data. A power-law is plotted for reference (black line). Code for this model can be found at: https://github.com/cfarrior/Sleeper-Distribution |