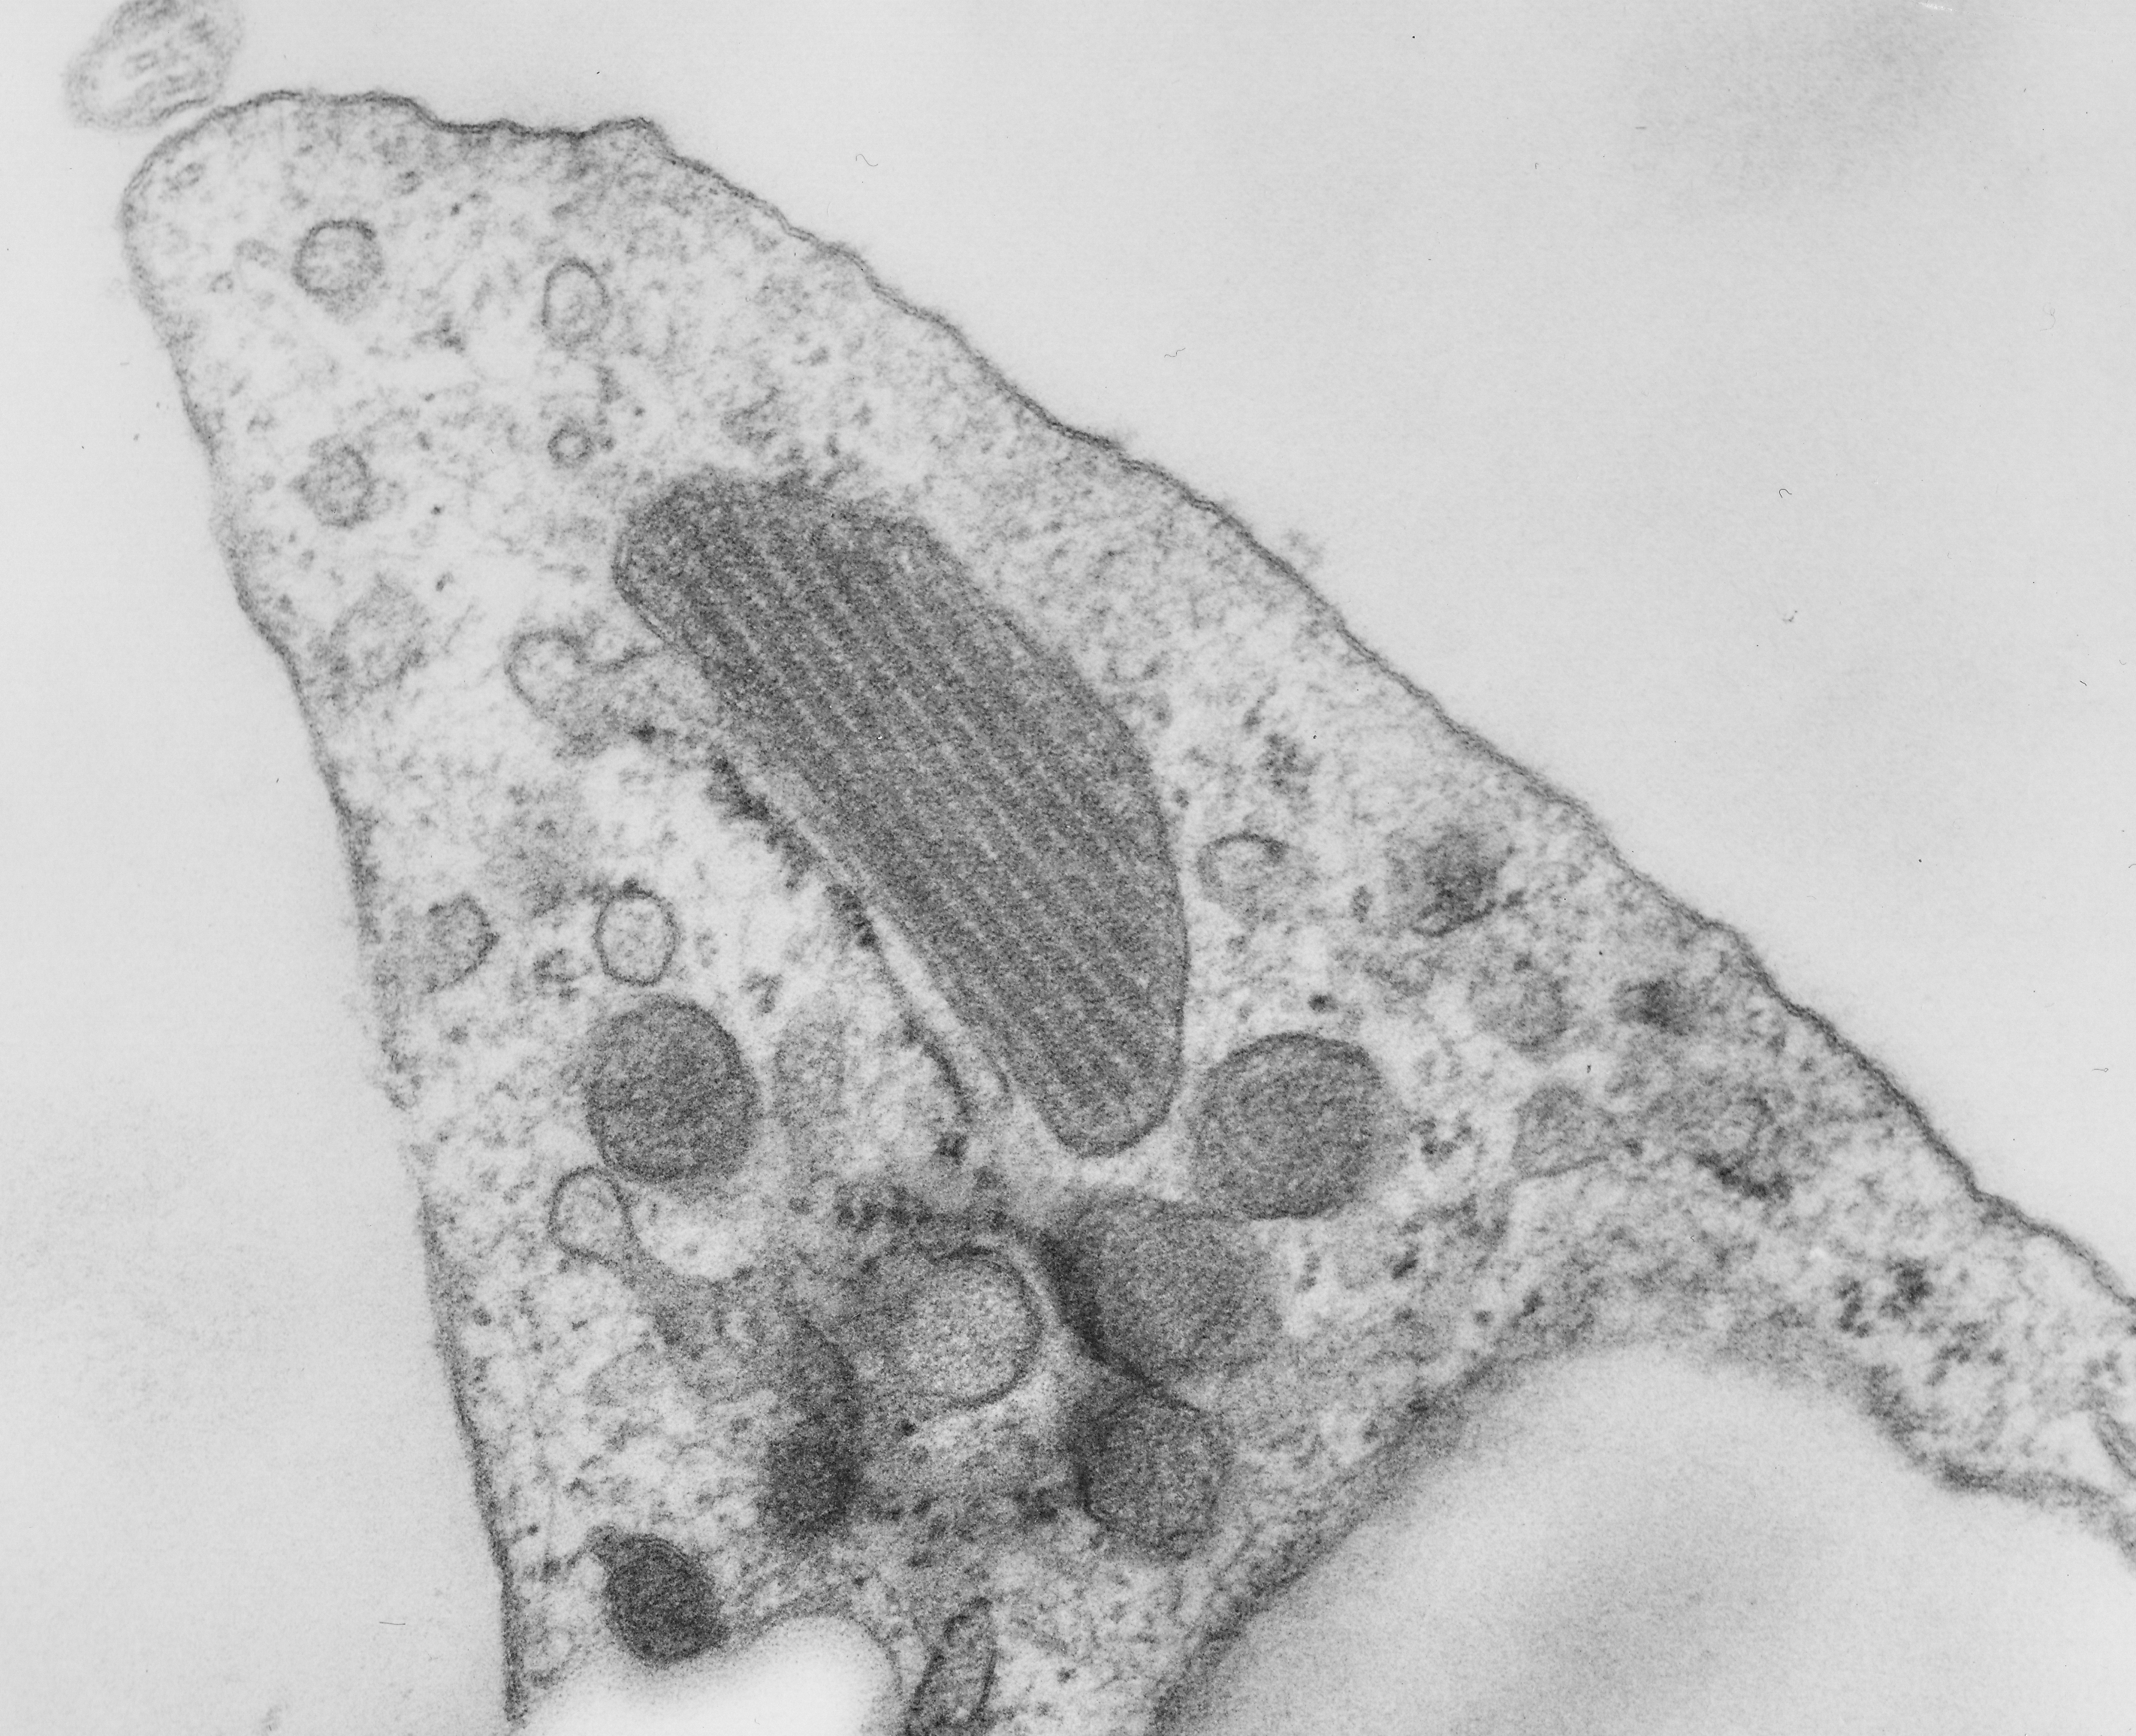
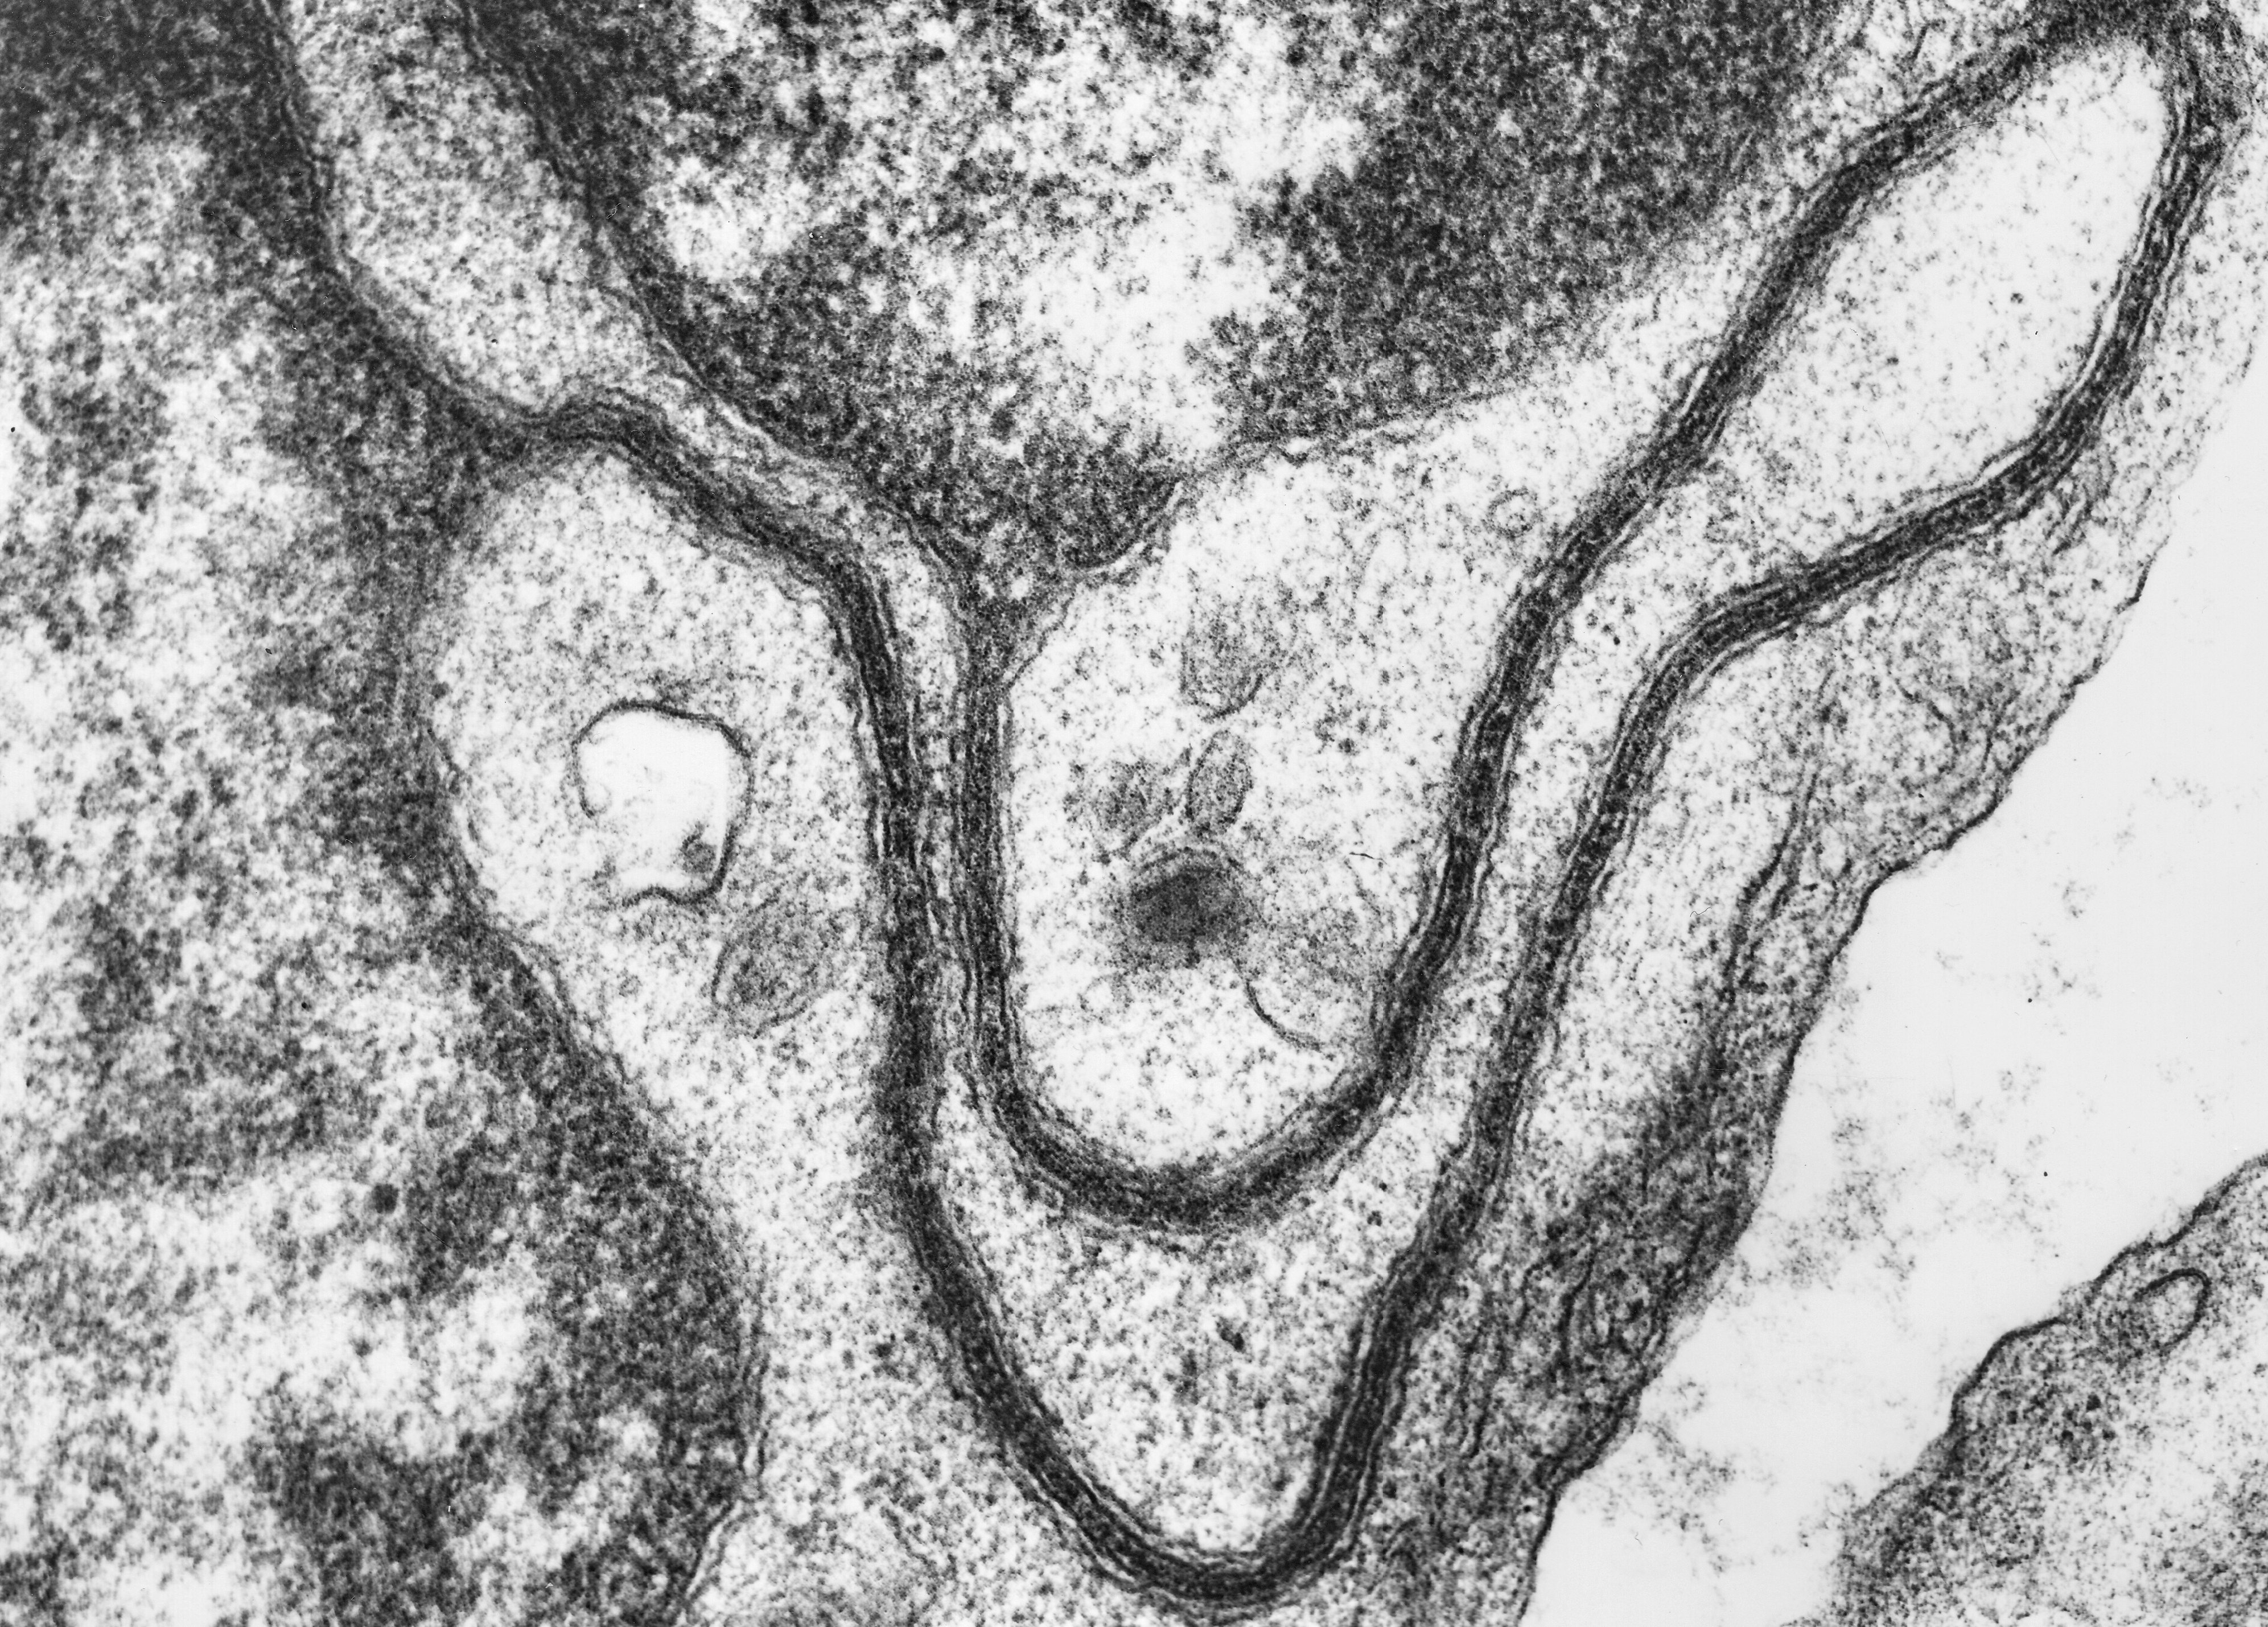
Fig. 7.1.28. Intramitochondrial crystalline arrays (arrows) in leptomeningeal (upper figure) and tumorous cell (lower figure). Scale = 1 µm. (Rabbit, pia mater; human, brain tumor.) Download the high resolution image (a); Download the high resolution image (b).